sBlot
Pie plots
Pie plots show how often each object is assigned to each cluster in the posterior,
for example, how often a language is assigned to each area. The figure below shows pie plots from an sBayes
language analysis with seven clusters.
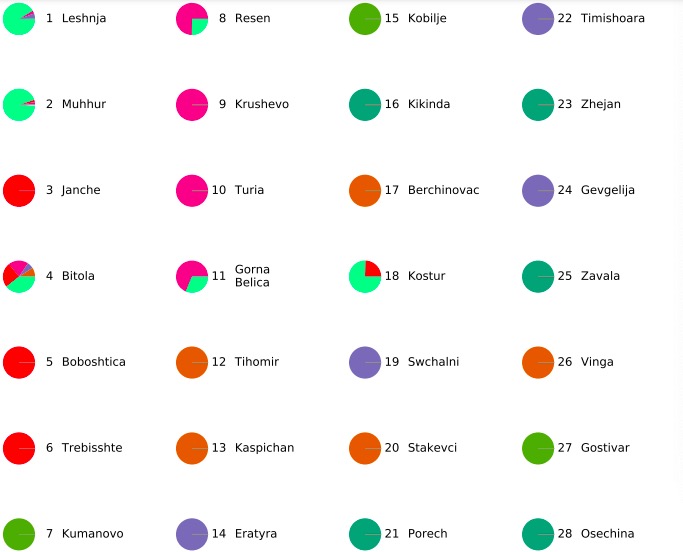
Pie plot for an sBayes analysis with seven clusters.