sBlot
Interactive explorer
The interactive explorer is a browser-based application for inspecting posterior samples from an sBayes analysis.
Unlike static plots, the explorer allows users to interactively step through posterior samples or summarise them over a range, making it useful for diagnosing MCMC convergence and exploring the posterior distribution.
Launching the explorer
From the command line:
sblot-interactive --conf family
Then open the interactive map in your browser at the address shown in the command line, e.g., http://127.0.0.1:8050/.
Additional options:
| Option | Default | Description |
|---|---|---|
--conf |
required | Name of the confounder column in the data CSV e.g. family |
-d, --data |
null |
Optional path to a data CSV file to pre-load on startup |
-p, --port |
8050 |
Port used to serve the application |
-c, --crs |
epsg:4326 |
Coordinate reference system of the input data |
Data tab
After uploading a data CSV file, the Data tab shows a geographic map of all objects and two subtabs:
- Groups by confounder, a bar chart showing the number of objects per confounder group. Hovering over a bar highlights the corresponding objects on the map.
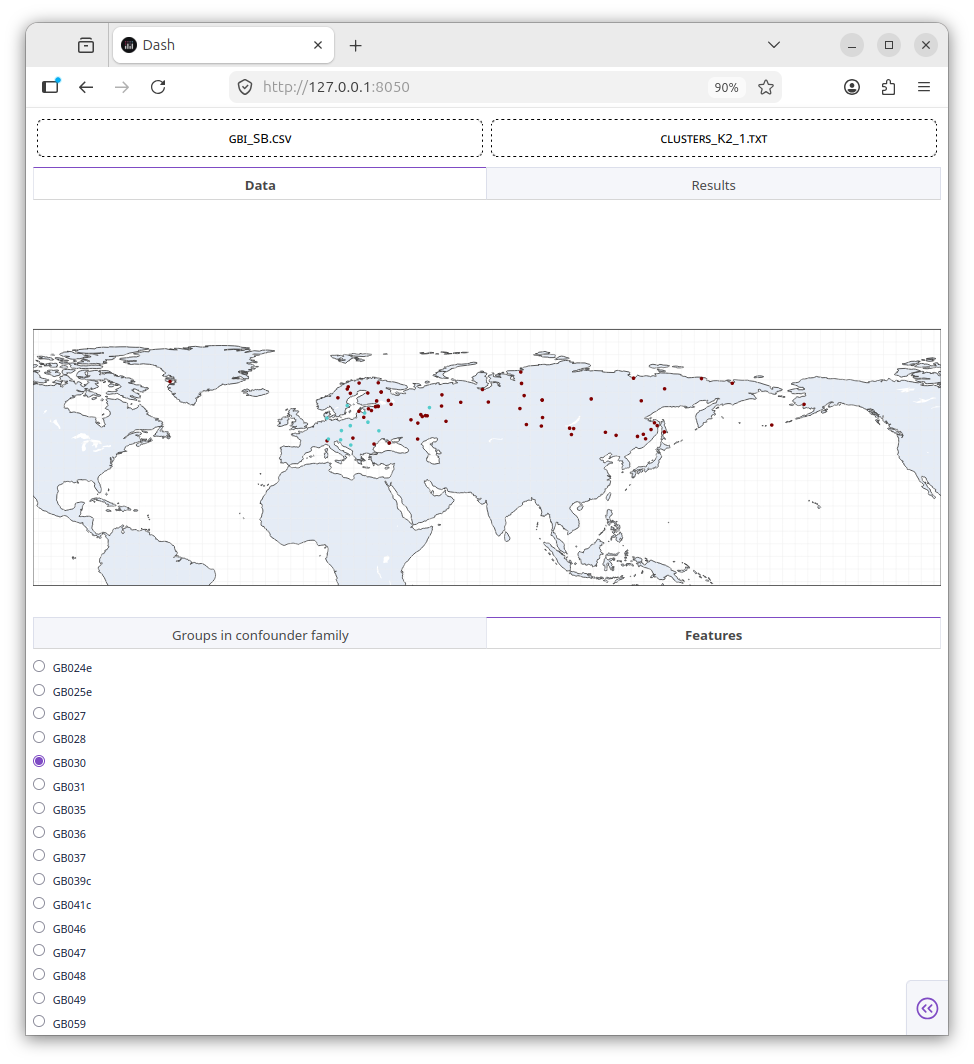
- Features a radio selector for coloring the map by feature value. Selecting a feature colors each object according to its state for that feature.
The figure below shows an interactive feature map.
Results tab
After uploading a clusters file (clusters_*.txt), the Results tab becomes available. It shows:
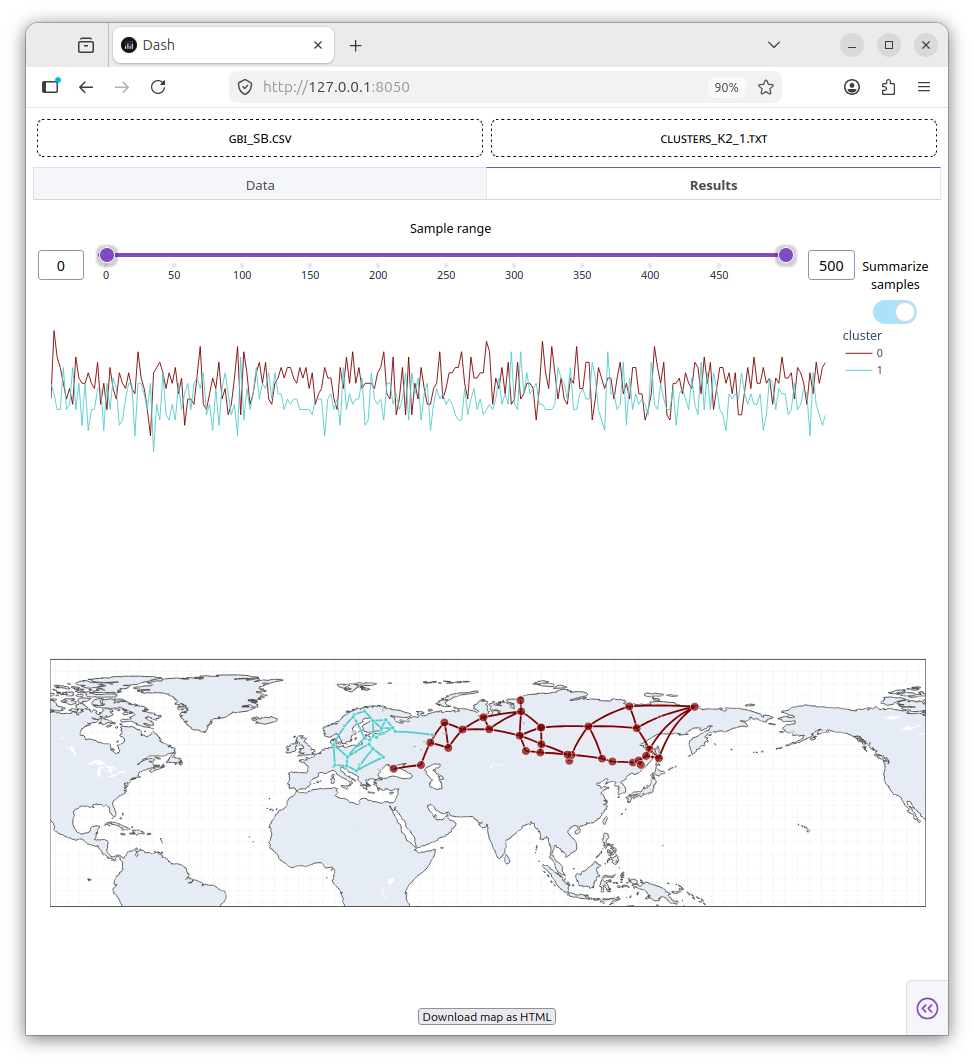
- Trace plot: the size of each cluster over all posterior samples, useful for inspecting MCMC mixing and convergence. Hovering over the trace plot highlights the corresponding cluster on the map.
- Map: a geographic map of cluster assignments. Two display modes are available:
- Summarise samples shows the mean cluster assignment over a selected range of samples. Objects are assigned to the cluster with the highest mean posterior probability above a threshold of 0.5. The range is controlled by a range slider.
- Single sample shows the cluster assignment for a single posterior sample. The sample is selected using a sample slider or by hovering over the trace plot.
Downloading the map
The current map can be downloaded as a self-contained HTML file by clicking the Download map as HTML button. The downloaded file can be opened in any browser and shared without requiring sBlot to be installed.